
A commenter on my earlier post about supporting public education and “Super Referendum Wednesday” asked specifically about the Christina School District’s two failures last year and if there were any themes from no voters about why they voted the way they did. Rather than answer it inline, I felt those themes deserved their own posts for visibility sake so the misinformation we have campaigned against for the last several years is out in the open.
Yes, there are common themes among the no-voters that emerged from both elections, and they persist today. Check out the CSDpavingtheway or Official District Facebook pages for proof. Better yet, read the comments on any article the News Journal posts about Christina on delawareonline.com, just be sure to have your eye bleach ready.
Theme 1: Top heavy, bloated administrator staffing – if only the fat-cat administrators would sacrifice themselves, teachers could be saved! Over 100 administrators make over $100k a year!
- Wrong. Why? Christina doesn’t have 100 administrators, last year there were 78. This year, 72. 50 are school leaders, 22 are district administrators.
- Well, what about the bloated 100+ $100K salaries?! In FY16, there are 87 employees that earn $100k and they are not all administrators and that is out of 1,837 district employees. 95% of Christina employees make less than $100k/yr.
- But Delaware Department of Education says the District has 90 Administrators right on their site!
- That is because Christina has the distinction (and honor in my opinion) of managing two Statewide Special Programs on behalf of the State of Delaware: Delaware Autism Program and Delaware School for the Deaf and because Christina manages them their totals roll into Christina’s numbers on DOE’s site even though they are not part of the Christina School District. (Remember this piece of information, it’s important)
- In total the Special Programs have 15 administrators. Add to 72 and that gets us 87. Still not 90, but if you round-up I guess it’s close enough?
- How does Christina stack up to neighboring NCC districts in terms of administrator positions? Here’s the total number of administrators by District in New Castle County:

- Christina Administrator Breakdown across 26 traditional schools:
- 24 Principals
- 26 Assistant Principals
- 3 Directors (Elementary, Secondary, and Special Ed)
- 10 Supervisors (transportation, maintenance, facilities, etc)
- 7 Managers (financial, business, program, etc)
- 1 Superintendent
- 1 Assistant Superintendent
- 50 of the 72 positions (70%) are school leadership positions.
As you can see from the above breakdown, Christina has 26 traditional schools but only 24 principals. Why? Schools must hit a threshold of student enrollment to “earn” a Principal funding unit from the State. If they don’t hit the threshold, they don’t get state funding for a principal, even though they are a functioning school. There are principals in all schools in Christina, but district taxpayers must make up the difference in salary between assistant principal and principal in the schools without an “earned” principal.
This is the Student to Administrator ratio for the NCC districts.
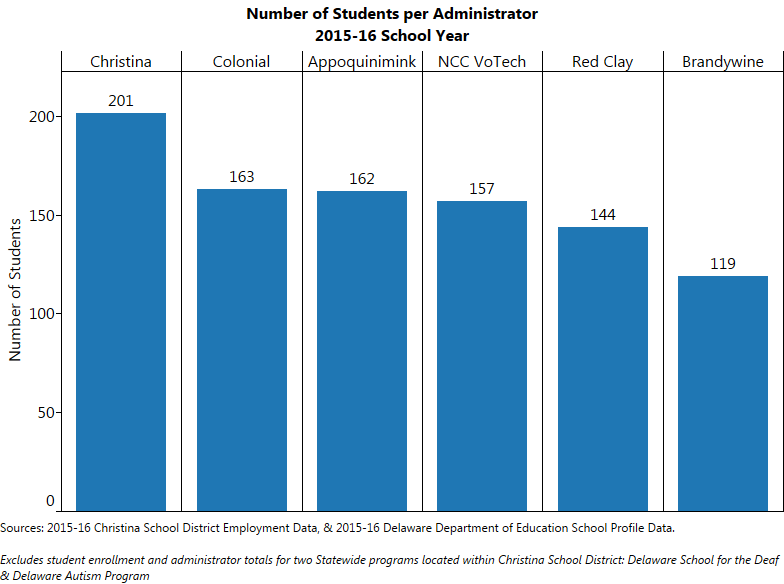
For every 1 administrator whether it be district or school, there are 201 students. The number is even more absurd when you only calculate for principals and assistant principals (50): 14,502/50 = 290 students per School Administrator.
This is a comparison of student enrollment and administrator totals.

Orange bars: Total student enrollment. Blue/black lines: Administrator totals. Notice the apparent correlation between the admin and enrollment totals for each district. See any outliers?
The District employs 1,047 teachers and 97 paraprofessional aides. That means 62% of the staff are educators. The District has 72 Administrators making up 4% of all employees. District Level admins make up 1.2% of the employee list meaning 98.8% of Christina employees are either in School Buildings or are directly affiliated with school buildings (bus drives & aides, curriculum specialists, etc).
TL;DR: Christina has, by far, the LARGEST student to administrator ratio in the County and has disproportionately fewer administrators than our sister districts despite being the 2nd largest school district by student enrollment. Yet Christina continually gets yelled at for being “top-heavy”.
Theme 2: Christina spends more per student than [insert other district name here] and still performs worse! Why do they need more out of MY pockets?
There’s an important distinction in the phrasing of this question. People who ask this question want to know what amount of property taxes go to each student. They’re not asking what the total from the State, Federal and Local shares are. They want to know what THEIR collective property taxes pay for and the answer is a hot mess.
- The ‘expenditure per pupil’ statistic on Delaware DOE’s site is probably one of the worst non-standardized test related data points ever created for education. (Kevin O. if you’re reading this, that qualification is for you). Whoever thought it was a good idea to display it that way should be fired. It reads “District Expenditure per Pupil”. Purposefully misleading if you ask me because the number includes State and Federal funding in addition to local District funding (from property taxes), AND it has Special Ed funding for programs not exclusive to Christina rolled into it.
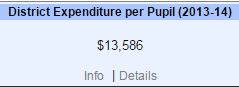
2013-14 District Expense per Pupil, Christina School District from Del. Dept of Ed site.
- Every student has different levels of educational needs, levels which need different resources. Those resources cost money and as such, cost per student varies depending on the student’s needs.
- Local (Property Tax) funding in DE has 3 “tiers” of general education funding and 3 “tiers” of special education funding, each with its own $ amount attached per student. See below:
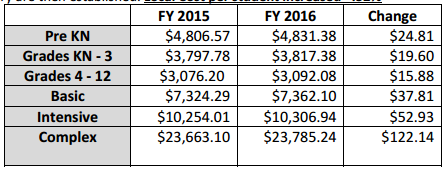
Local per student funding amounts by student category. Del. Dept of Ed
The State sets the categories and amounts. Basic, Intensive, and Complex funding is reserved for students with increasing levels of need beyond general education, with Complex representing the highest need level.
- If Jim Bob Christina-Homeowner wants to know what property taxes pay for (which is what we get asked), we have to exclude State Funding and Federal funding and only look at the local share of funding, represented in the table above.
- To do the math on an ‘average’ In-District (as in local taxpayer-funded) expense for a Christina School District student at first glance you might think to add the amounts in the “FY16” column and divide by the number of student funding categories (6) to get an ‘average’ of $8,865.85 per student. But this method is only correct if the same number of students are in each category, and that is far from the case.
- As of FY16, 91% of Christina’s local share of per student expenses goes to the general education categories of student funding (Pre KN, KN-3, 4-12). In-District students categorized under the three special education categories make up the remaining 9% of the student population.
- When you control for that allocation, the average Christina School District Expense from Local Taxpayers per student is: $3,982.33. An oh-so slightly different amount than the one portrayed on DOE’s site.
- By the way, know what one of the biggest influences on a student’s ability to achieve and succeed in school is that isn’t represented in education funding anywhere in Delaware? Poverty. Higher level of poverty = greater difficulty in academic success. The only place poverty is represented in Delaware Education is in Standardized Test Scores, and the food & clothing pantries in schools, and the cafeterias where schools host family dinners…
Why DDOE uses such levels of obscurity and makes it that hard to figure the property owner’s share of funding out I have no freaking idea. But there is your average local taxpayer share of per student funding in Christina; $3,982.33. I do not know what our neighboring districts’ property owners spend per student, and I’m not figuring it out. My brain is shot and it’s only 3pm on Monday. Perhaps we could ask the other District’s Citizen’s Budget Oversight Committees to determine it. And why DOE requires Christina to roll up all DSD and DAP figures as part of the District’s also baffles my brain.
Is there a reason DOE can’t separate out Special Programs, State Share per Student, and Local District Share per Student on their site? Hell if I know.
TL:DR; We probably don’t spend the most per-student but how the hell are we supposed to explain that to the average homeowner who has no clue how complex this is and only pays attention to it during referendum (tax-hike) time and just votes on “More Taxes?” or “Not More Taxes?” ?!
There’s two of the overarching themes. I literally can’t handle sharing more now. I’ll get to it over the next week and a half leading into Super Referendum Wednesday.
My overarching theme is, how are we supposed to explain this mess to voters who are only interested in it once every 3-5 years? More to come.