
There’s no doubt that finding good, clear, and actual information about any aspect of Delaware’s education system is like trying to find little needles within acres of haystacks. What makes it even more difficult is when a source of truth is found, other groups who have something to gain by distorting the facts and truth pop up to confuse and mislead people even more.
And that’s probably by design.
The last post I wrote about per-student expenses in the Christina School District apparently grabbed the attention of a couple of the groups I described above. I’ll give them credit for actually trying to calculate the numbers for education spending out to a per-student expense, because that’s about 200x more effort than they gave last year when they just ran with a bunch of incorrect BS designed to scare people. Their creditworthiness ends there though.
As I have said over the last 2+ years, using the State of Delaware Online Checkbook is about as useful as a screen door on a submarine. It shows expense categories and number of payments. Using that checkbook to figure out expense details is like wanting to know the total $ amount I spent on groceries and saying “Food – 54 payments, $8,000” is the answer. Sure some of that is on groceries, but some is probably on fast food, restaurants, concessions, takeout, etc. And my wife contributed some of her income to food purchases, too. How will you know how much of my income I spent on groceries from Shop-Rite, or Acme? Good question. You can’t tell from the Online Checkbook. Better trim that food budget though $8k on food looks awfully high!!
Anyway, this is where me giving credit stops abruptly. Everything from then on in their post is just completely, totally, utterly off base, borderline lying.
Proponents of the tax increase insist that cost per pupil is not $13,586 as it is listed on their state profile. They assert that when the specialty schools are factored out, cost per pupil is competitive with nearby private schools, which is $10,000 per pupil and under.
I assume, perhaps wrongly, that they’re referring to me as the “proponents”. I explained that the actual cost to Christina taxpayers is much lower than what DDOE projects on their School Profiles site. I don’t believe I ever compared it to cost, functionality, or demographic make up of private schools.
By the numbers, it appears they are partially correct. It may not be $13,586 per student. However, it may actually be more.
Enrollment in the district is down 3,680 students since 2006, yet school taxes have continued to increase. In 2014, there were 16,721 students. In 2015, that number dropped to 16,255. For 2016, it dropped even further to 15,553 students.
Enrollment in the district has been declining and school taxes have gone up over the last 5 years (something something, increasing Special Needs student enrollment funded by Tuition Tax, not general operating tax). Let’s continue.
If expenditures remained the same for FY 2016 as they did for FY 2015, the Christina School District’s non-Autism/non-Option ILC/non-Reach/non-Deaf expenditures of $251.5M would fall to around $17,751.89 for each of the 14,170 students.
This is still $7.7K higher than the district insists their cost per pupil is, so we wanted to further work the numbers as best we could to the district’s advantage.
No, you didn’t. You took the district enrollment total, tried (and failed) to adjust for special ed enrollment and used it to divide the TOTAL operating budget (including State, Federal and Local sources of revenue) and claimed it was the expense per student in the District AND THEN used it to argue why Christina taxpayers should vote against the Operating Tax referendum.
The Operating Referendum reflects what Christina Taxpayers exclusively pay to support the functioning of their public schools. Those monies are termed LOCAL FUNDS and to really give them a picture of what they directly spend supporting Christina, you must EXCLUDE state and federal revenue. By doing that you are light years ahead of controlling for special ed enrollment in your math than just randomly selecting two disabilities and subtracting students in those categories.
Furthermore:
Source: Christina SD FY16 Final Budget
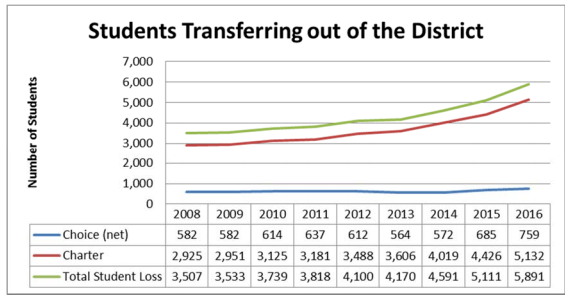
Whoops, those other guys left this nugget out of their calculations. Christina has almost 5,900 students that LIVE in the District (and as such receive funds using the same methods and tax sources as kids in district schools) but don’t actually go to district schools. They’re still part of Christina’s expenses because the local funding follows them to Charters. DDOE makes it hard to total them up too because they list each charter as its own “district” so you have to manually figure out which Charter is in which district and add enrollments. Or you could attend a CBOC meeting and find out the same day.
Source: FY16 Christina SD Final Budget
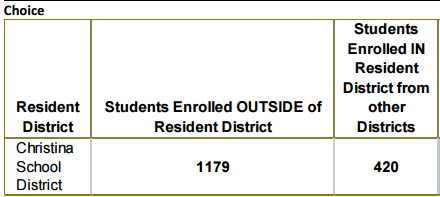
They left this nugget out too. Christina funds students who choice out of the district with local dollars too. 1179-420= net 759 students Choiced outside the district. You can find that out at CBOC meetings too.
And you know, I controlled only for in-district students as well in my previous post. However, if we want to be completely accurate, we can’t ignore charter and choice students, because they get the same local dollars that in-district students do. Also, trying to separate out special ed students that are in our district schools is difficult as well. So there’s some variance depending on which of the dozens of factors you include/exclude when you do the calculations. And I’ll fully admit, I miss an exclusion or inclusion when I try to do it myself. What I do not do is mislabel, or not label at all, the numbers I’m using in the calculations. It’s absurdly complicated to figure out per-student expense, but when I do it I try to make sure you know the numbers I’m using.
So, how many students in total are Christina taxpayers supplying local operating funding from their property taxes for?
Regular District: 14,502
Charters: 5,132
Choice: 759
Total Students locally funded by Christina property taxes: 20,393. Twenty Thousand Three-Hundred Ninety-Three.
Non Special School Budget: $222,079,358 / Non Specialty School Enrollment: 20,393
Expense Per Pupil: $10,899.97 (Combined State+Local)
But we want Christina resident property tax funds.
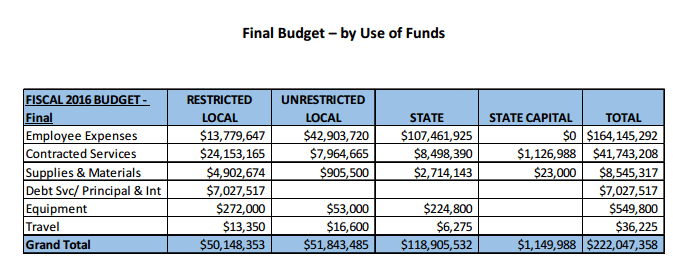
Source: FY16 Christina SD Final Budget
Property tax funds are in “RESTRICTED LOCAL” and “UNRESTRICTED LOCAL” columns. Adding them together: $101,991,838
$101,991,838 / 20,393 = $5001.31 per pupil from operating taxes generated by property taxes.
What did those other guys get?
…Fuzzy Math…
$251,544,302.58 / 15,835 = $15,885.34 per student.
Yes, it is a mess. No doubt. But no matter how you slice it, CSD schools do not yet appear to be fiscally competitive with private schools in the area.
Ah yes. Christina residents only vote on operating tax rates, but let’s completely mislead them by throwing in every other source of funding EVER in our equation, and not tell them, to make everyone think they spend $16k per student from their property taxes!!! But even if you DO use State & Local sources to do a per-pupil expense and do the math correctly you still only get to ~$11,000 which, according to First State Liberty, is a bit more ‘competitive’ with the costs of unnamed mystery “nearby private schools, which is $10,000 per pupil and under.”
If only there were a group of dedicated people whose sole purpose was to know information like this. If only said group had meetings on a regular basis that are open to the public. If only they’d reach out to others and offer time to help them understand public education finances. Man, groups like that would be awesome! And helpful!
Context matters. For some of us.
EDIT: In my haste to throw this post together, I’ve already noted some errors in what I have written. So I am going back to correct them. Most notably, why is the per-pupil expense higher in this post than the last post? The last post excluded all special ed student expenses, whether they were in the District’s schools or in Statewide Special Programs. This post considers traditional district school, charter, and choice students regardless of their level of educational need. It excludes statewide special programs. Per pupil costs will skew higher or lower depending on what student populations you include in your math. Including special ed students shifts the average higher. Excluding those expenses shifts it lower.
It’s why I keep saying ‘average per student expense’ is a pretty terrible way to look at how much educating a student costs.