
Open Thread for Monday, September 26, 2016
Posted by
 By
42 Comments
By
42 Comments
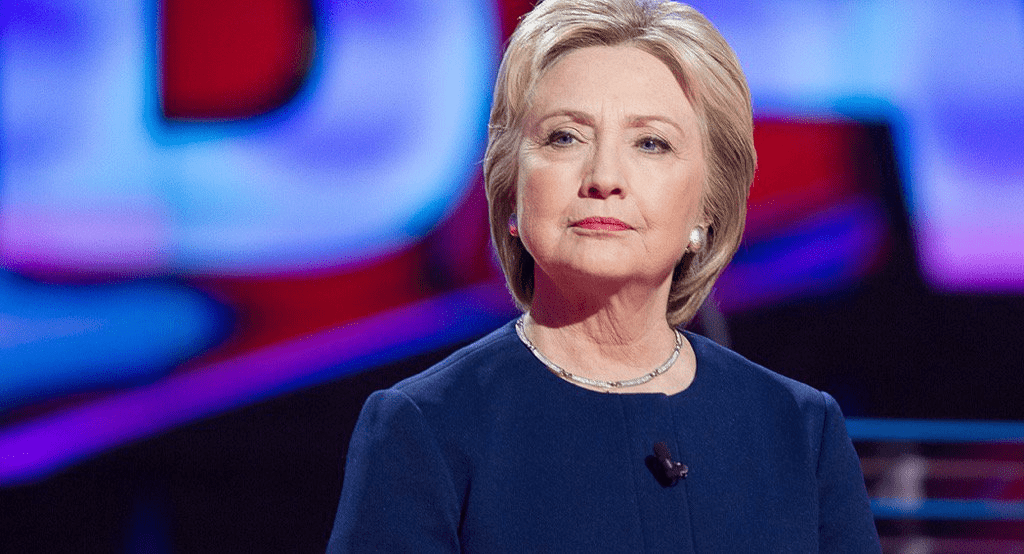
Josh Marshall on the state of the polling race:
First, let's compare the 2012 and 2016 races. Obviously, we have the full race data set for 2012 while more than a month of 2016 is still to happen. Still the comparison is instructive. I've filtered each chart to begin in May. [Click through to TPM at the link above to see the charts]. A few things immediately jump out. First, the 2012 race is much more stable than the 2016 race. This is likely do to having four candidates, two fairly unliked candidates and a race that is at least to some degree upsetting recent voting patterns. Second, Clinton has maintained a lead at all times. The lead ranges from very small (less than a single percentage point) to fairly substantial (high single digits). (It is important to note that statistically speaking, when you are talking about an average of many polls, a lead of perhaps two percentage points is not a virtual tie.) This captures the key factors in the race. It is close by historical standards but not closer than 2012, judged by the leader's margin. Indeed, over the course of the period we're looking at the 2016 margin has usually been higher than 2012's, sometimes substantially higher. Does this mean Clinton more likely to win than Trump? Yes. Does this mean it's close? Yes. Can you just assume Clinton will win and not worry about it? No. Should you channel your anxiety into self-doubt, recrimination and drama? Please don't. Pretty much everything else seems like a matter of semantics. My own hunch is that that line separating the two candidates is likely more durable than some suspect. But that's just my own hunch.