His district was, and is, going Blue in ’22.
To steal a line from Baseball Prospectus, my fantasy baseball Bible: “Warning: Gory mathematical details ahead!”
Even if Senate District 6 retained the exact same boundaries it has now (which it won’t), the trend was not Kathy’s Favorite Volunteer With Privileges’ Friend.
Here are the registration figures and percentages back in November of 2012, the first year with the current boundaries:
13,727 D 40%
12,597 R 36.7%
7,982 I 23.3%.
In 2012, Lopez defeated (how quickly we forget) Glen Urquhart by a 55-45% margin in the R primary. He then defeated Andrew Staton in a very expensive race, 56-43%.
In 2014, Lopez defeated Claire Snyder-Hall by a 63-37% margin.
In 2018, perhaps due to his Canoodling With Kathy, he barely edged out David Baker, 53-47%.
In 2022, not only was his district likely to be even less hospitable, he was almost certainly facing a primary from some RWNJ, because that’s how Sussex Rethugs roll.
Even before the redrawing of the lines, however, just take a look at the current registration figures:
20,588 D 40.2%
17,581 R 34.3%
12,829 I 25.5%
While the D percentage has remained roughly the same, there has been a pretty significant decline in the R %, and an increase in the % of unaffiliated voters.
Now just take a look at the change in the number of registered voters in the district over the past nine years:
2012: 34,306
2021: 51,268
That’s over a 49% increase in the number of registered voters in SD 6 over the past ten years. Granted, the increased percentage of voters does not directly coincide with the increase in population, but it’s a solid predictor. While I haven’t worked the numbers for all the other districts, I daresay that no other Senate district in Delaware has experienced that kind of growth, or anything close to it. (This also means that, were Popgun Pete so inclined, he could likely draw another D House district in coastal Sussex.)
OK, let’s go to the district map:
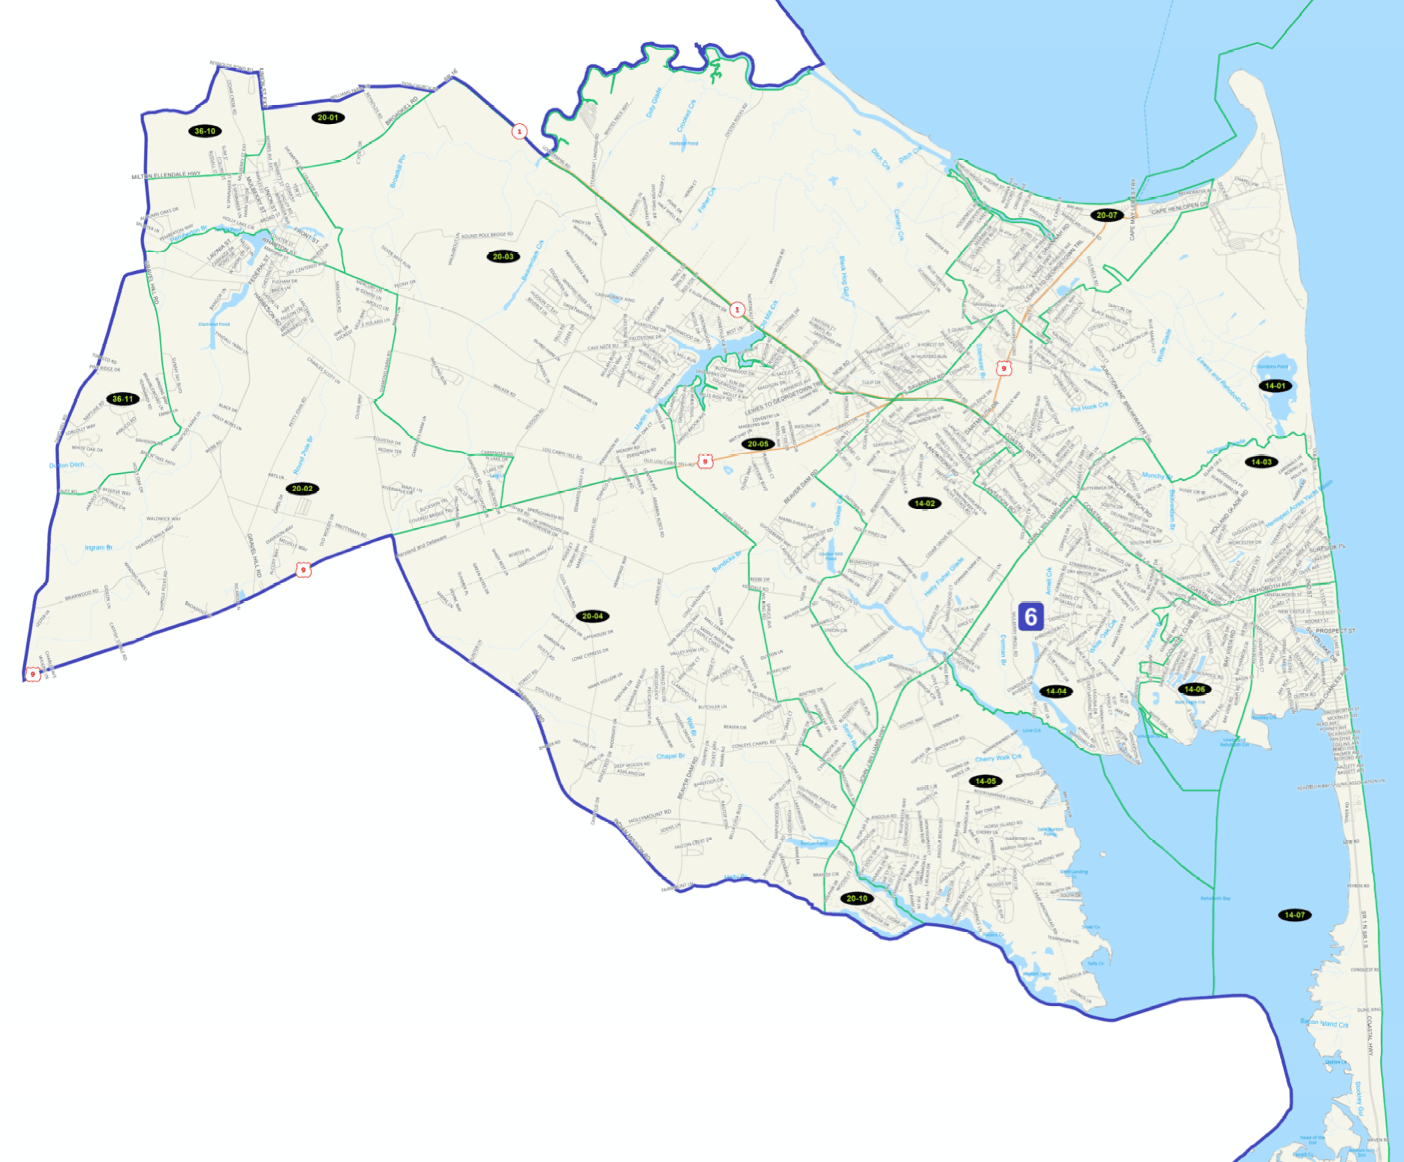

You can access the SD 6 figures by RD/ED here.
I’ve also broken down the results of the contest between Baker and Lopez, and I’ll insert the pertinent information.
Here’s what we know: We’re gonna have to excise a significant portion of this district. We can do it to benefit a generic Democrat and/or to benefit a progressive Democrat (I’m not sure that Baker fits the bill of a progressive, but there’s a strong progressive constituency in the district).
Anyway, going by the map, if you excise the following from the northwestern portion of the district, you on balance strengthen the D edge: RD 20, ED’s 1, 2, and 3; and RD 36, ED’s 10 and 11. Plus, you’re not gerrymandering the district, you’re making it more compact. Based on the 2018 totals in these ED’s, Baker got 2478 votes in these ED’s, and Lopez got 3159. I’d also love to get rid of RD 20, ED 4 as well, but I don’t know how the numbers will play out. Of course, there’s nothing magic about the shape of an ED. You can excise part of it. Each Senate and House District must be within plus or minus 5% of the average population based on the statewide census totals.
Making matters even worse for the R’s, a so-called ‘moderate’ like Lopez is likely the only type of R who could win in this district. Even if such a ‘moderate’ emerges, (a) they will not have the benefit of incumbency; and (b) they are almost certain to face a lunatic fringe R in the primary, who would likely be the favorite.
Yes, I could see a primary battle between a moderate and progressive D doing some damage. However, when faced with a RWNJ opponent in what is generally at worst a centrist district, I think everybody comes together.
Clip ‘n save: This district will elect a Democrat to the State Senate in 2022.